Value
What it is worth today.
One Cardmarket reading a day on the 11,640 cards the source prices, and every amount shown with the date it was measured on.
- Total cost, current value and performance — per purchase batch, per product and for the whole collection.
- Realised gain comes from sales, latent gain from readings: two natures, two figures, kept apart everywhere.
- An alert can watch a batch you own, or a catalogue card you are still after.
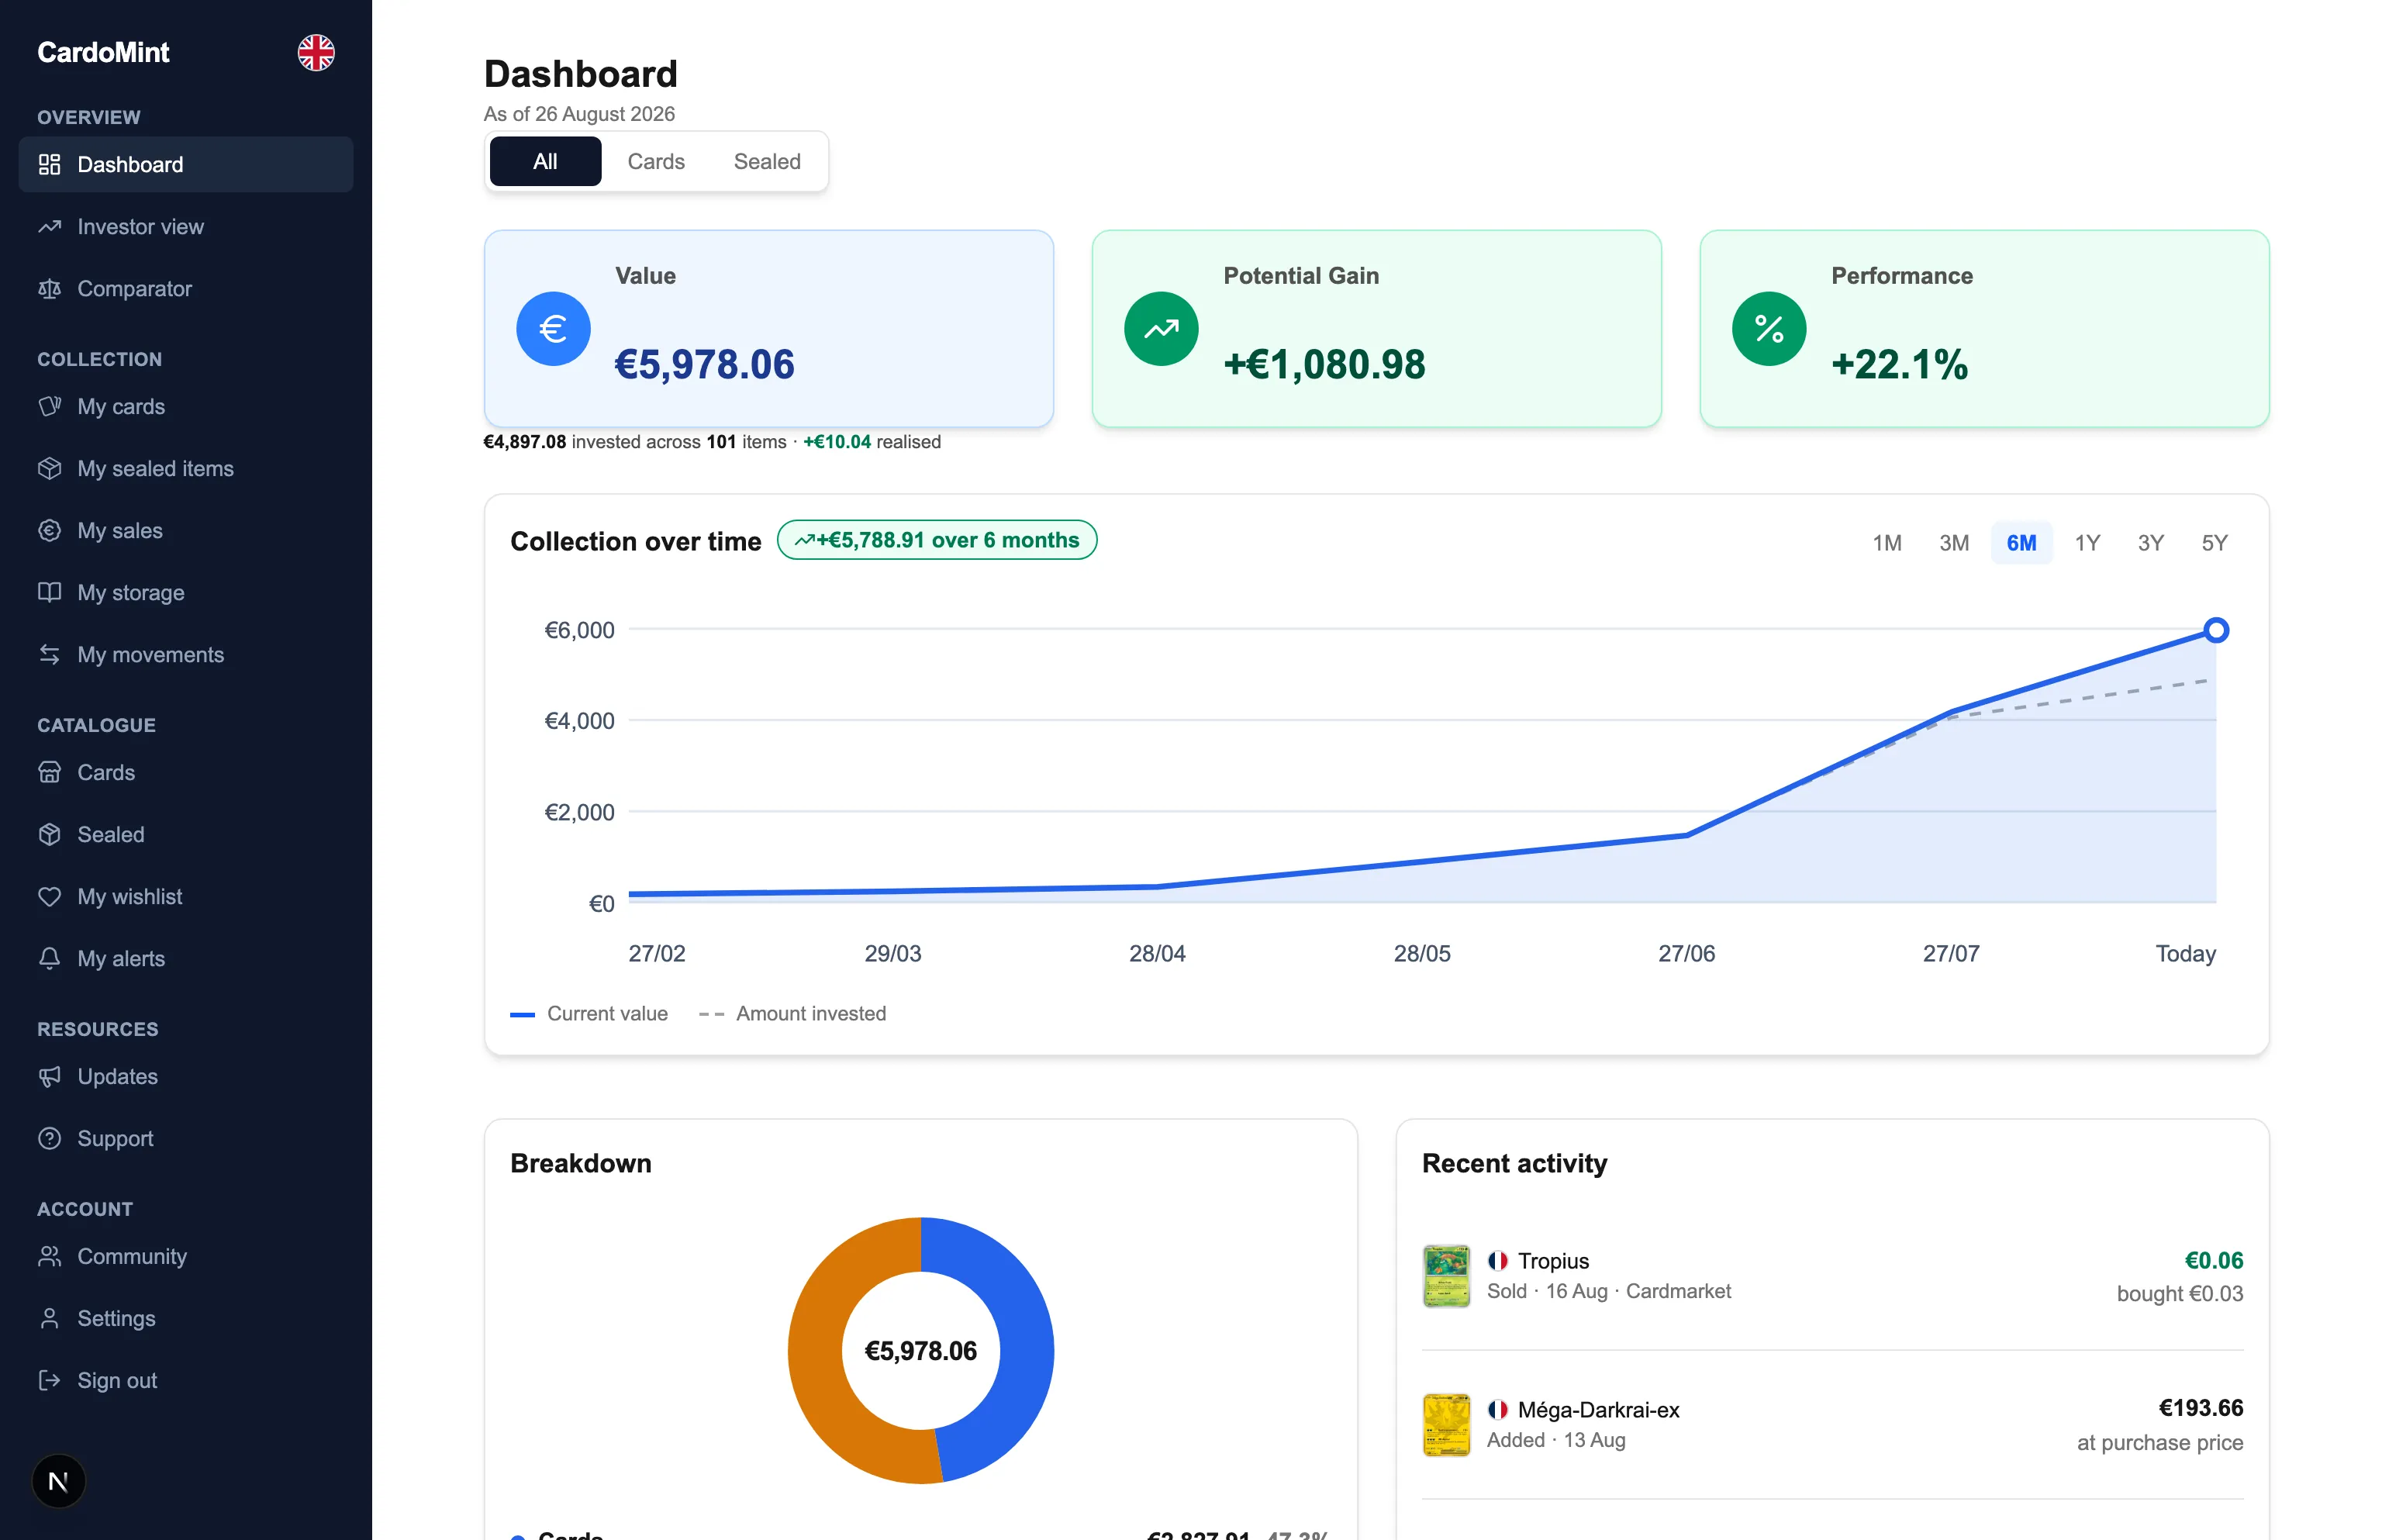
Today's value
Three figures, and their date.
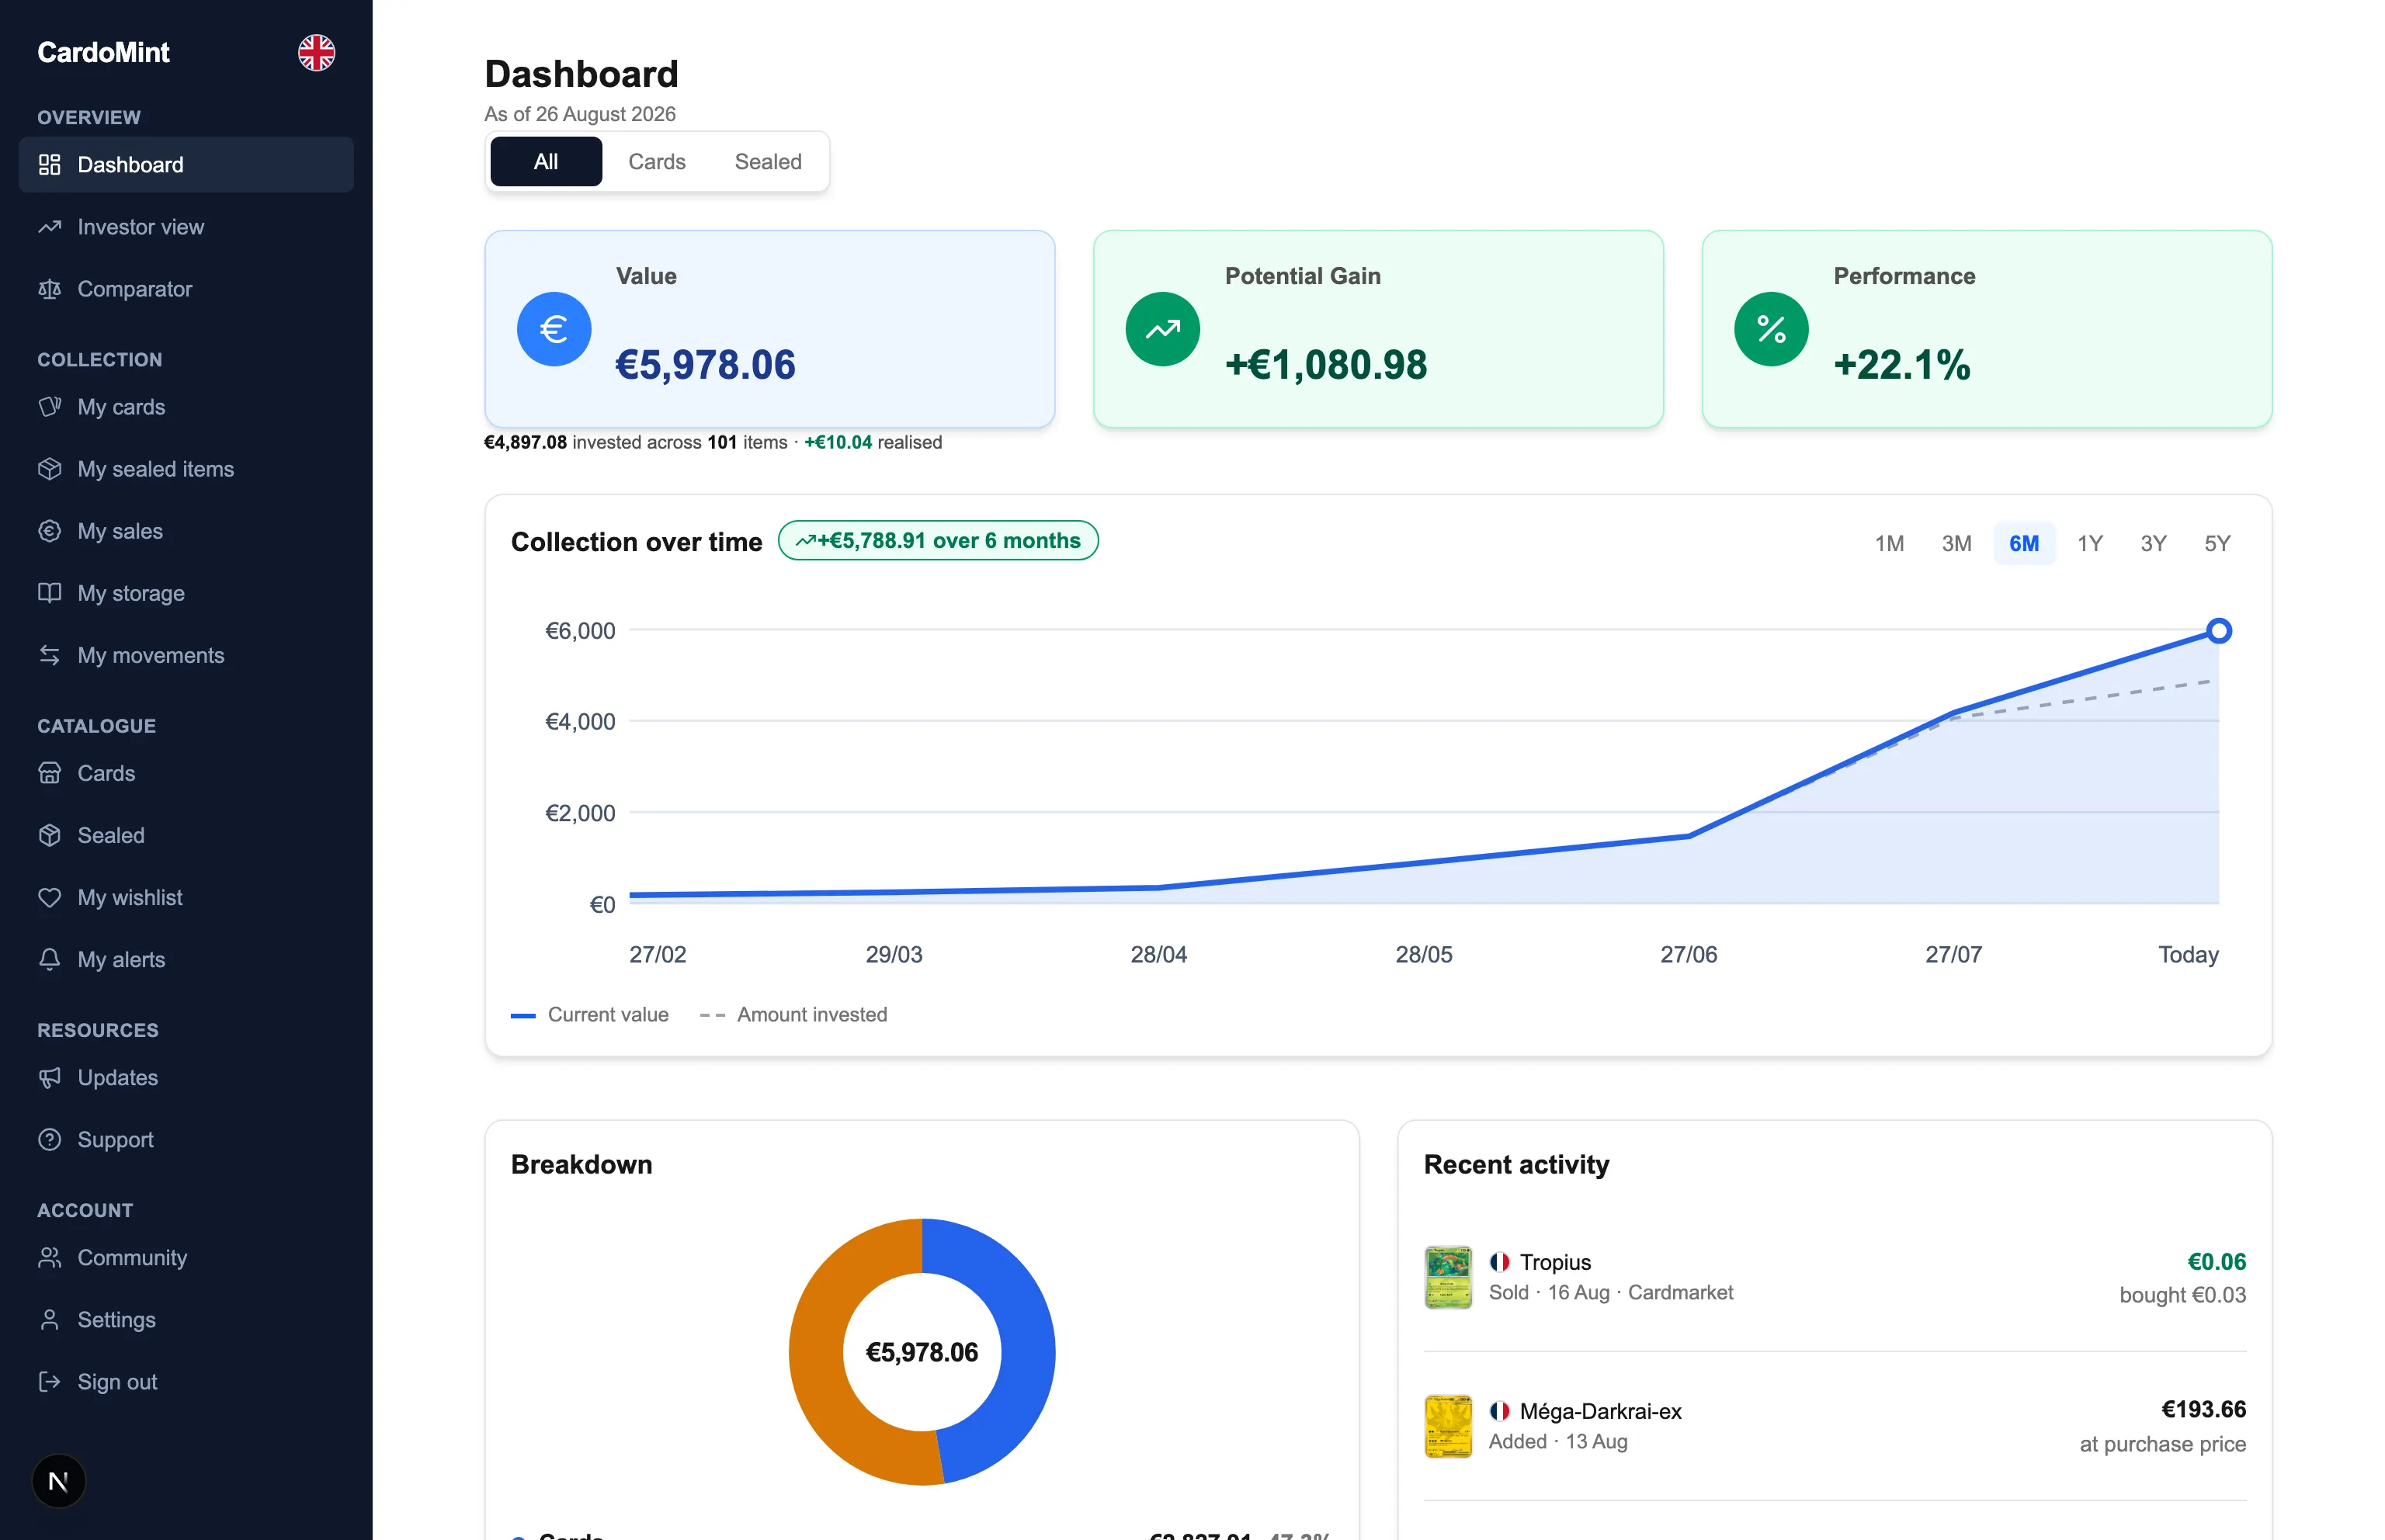
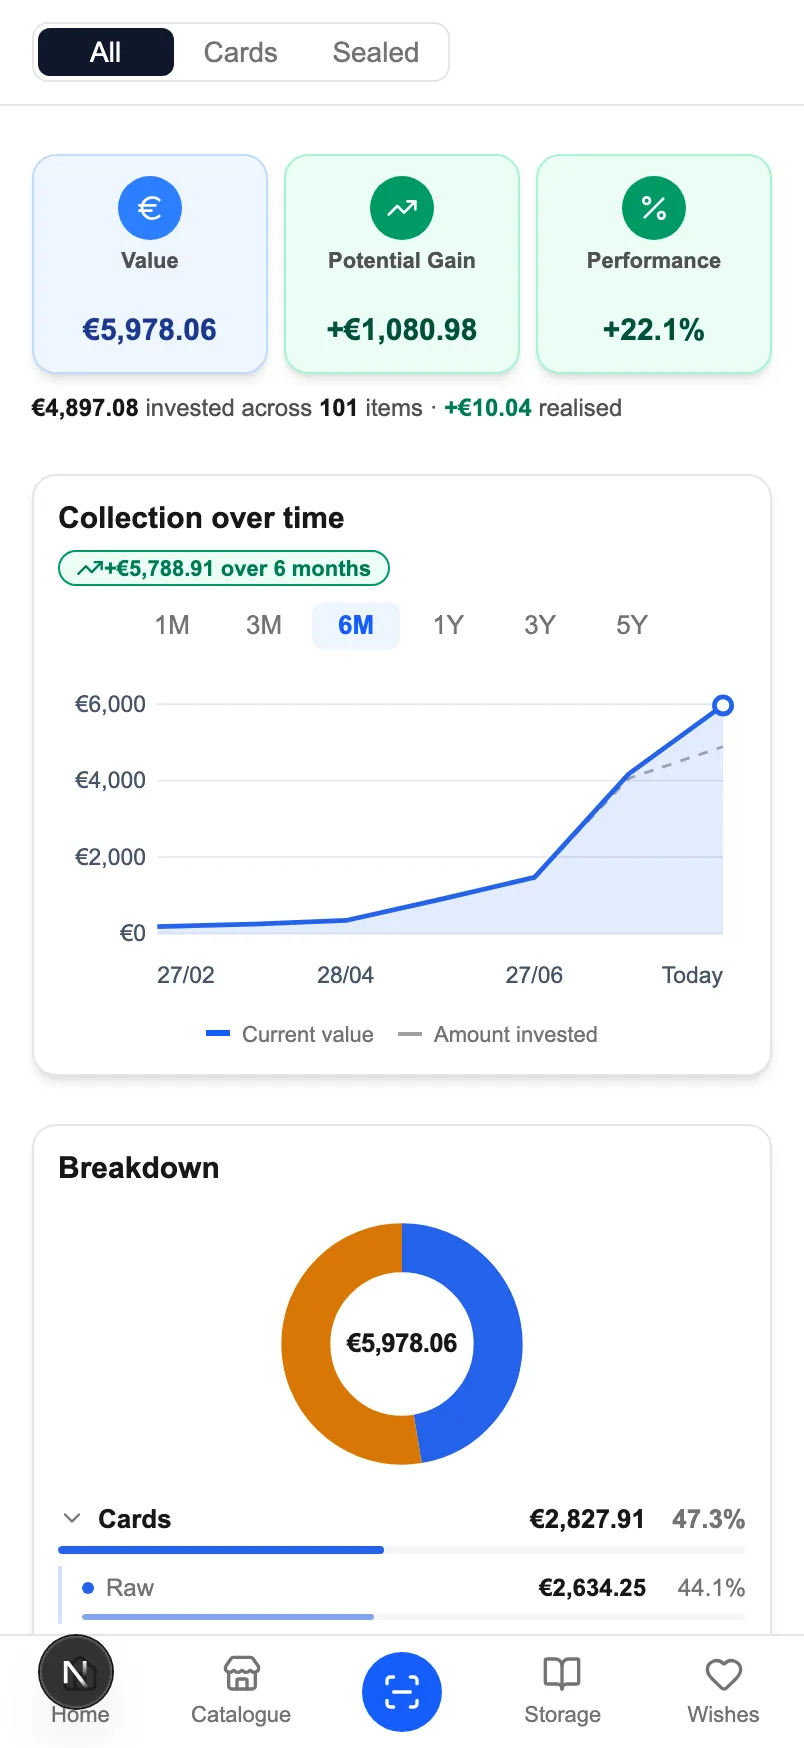
Valuation, latent gain, performance. The dashboard answers « what is it worth », « how much have I gained » and « is that a lot » at a glance.
- The All / Cards / Sealed switch recomputes all three scopes with no round trip: they are prepared server-side.
- The curve compares the current value against the amount invested, over six horizons — one month to five years.
- A ring breaks the collection down by nature and condition: graded cards, ungraded, sealed.
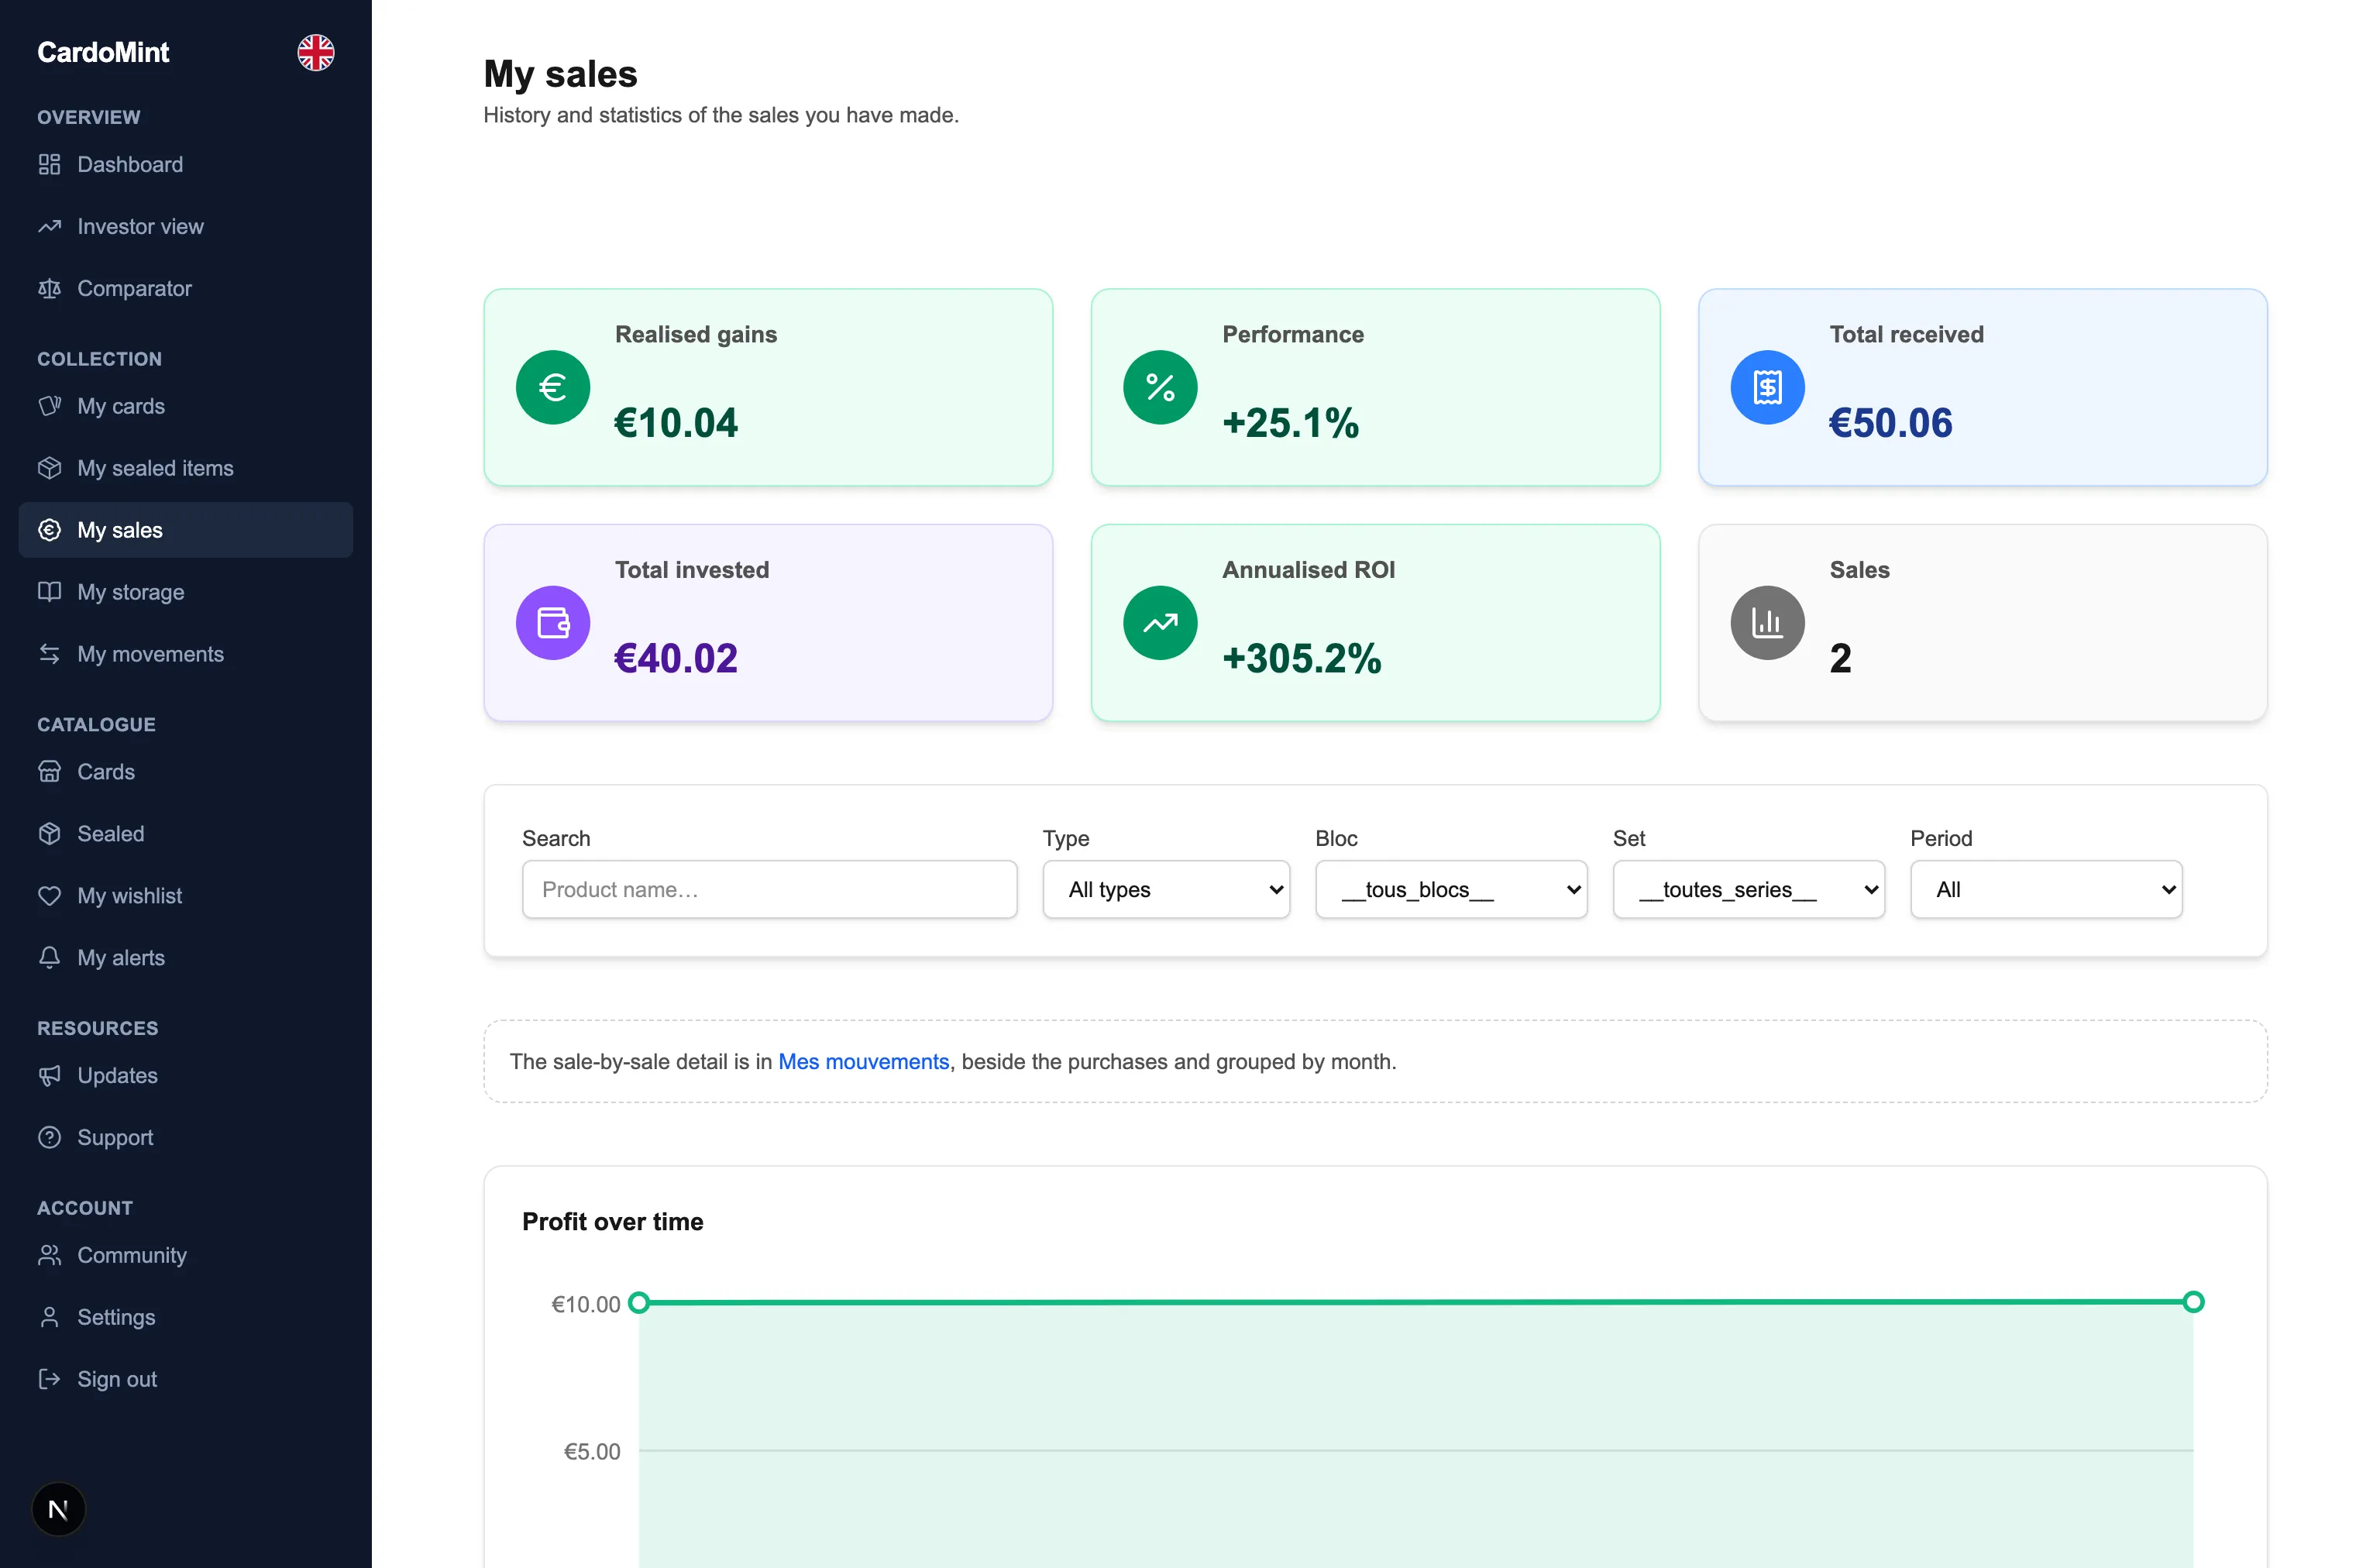
Realised and latent
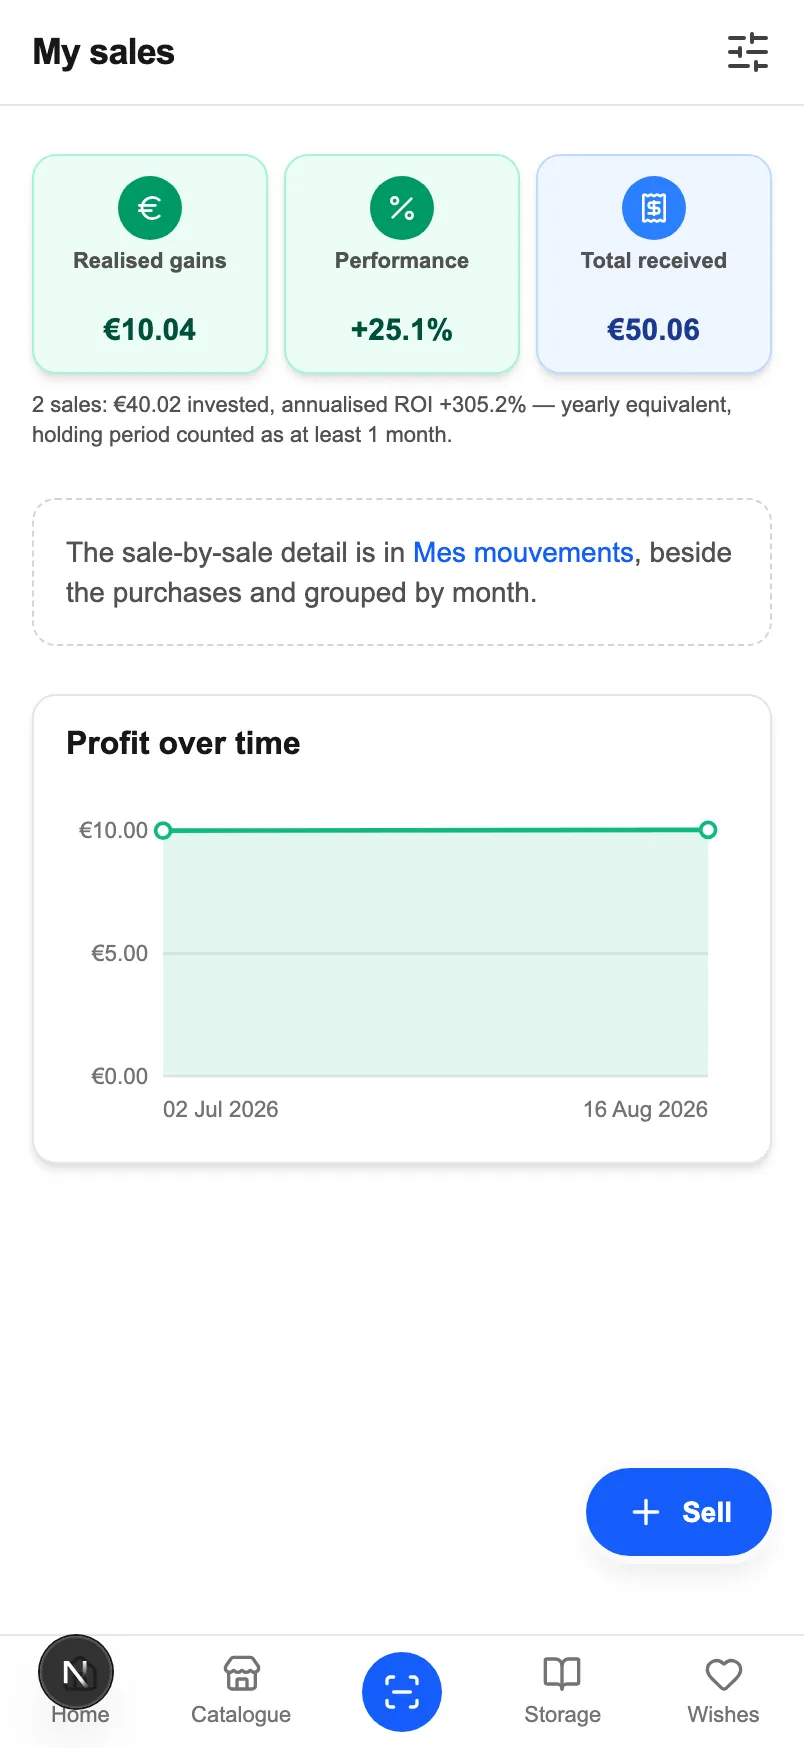
What a sale brought in is a fact.
What a card is still worth is an estimate. CardoMint keeps the two figures apart — in the tiles, in the charts and in the export.
- Selling a copy decrements the batch and creates a sale: the product can leave the collection while its sheet goes on telling what it cost and what it returned.
- Annualised performance is floored at one month on the denominator — without that floor, +30% over 29 days showed +49,921%.
- A curve accumulates realised profit over time, under the same filters as the history below it.
Position by position
ROI per object, and per set.
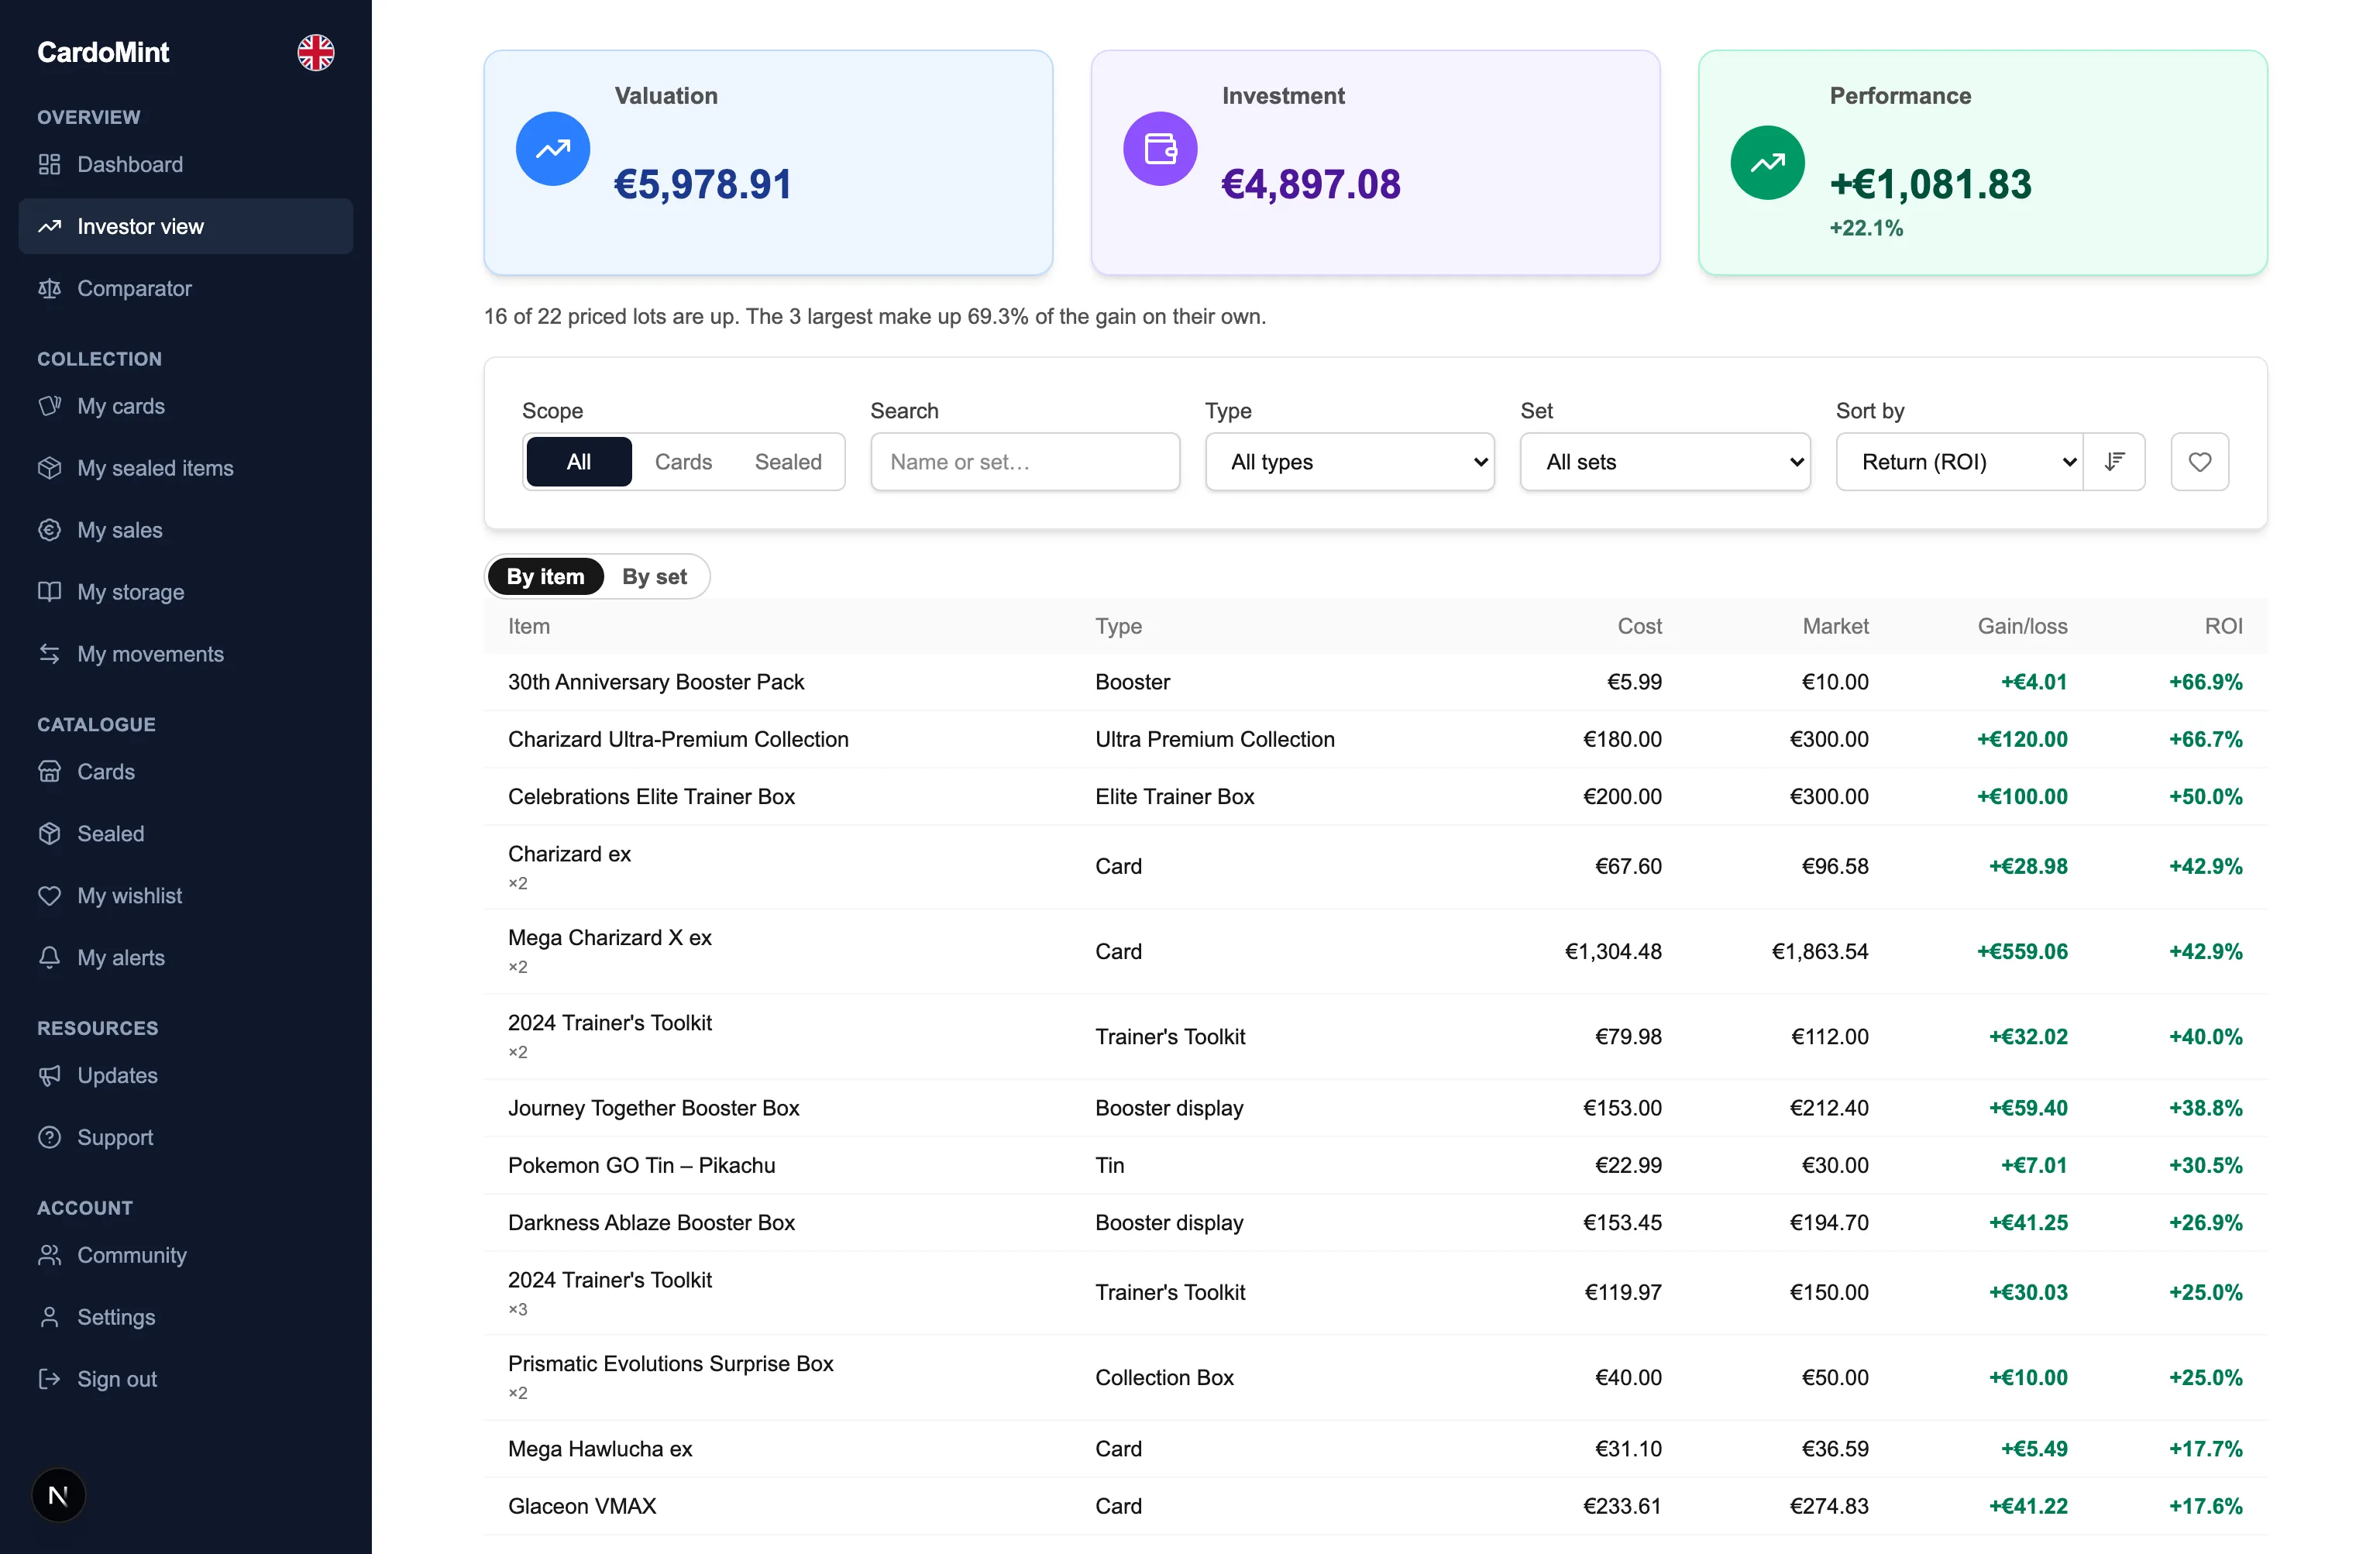
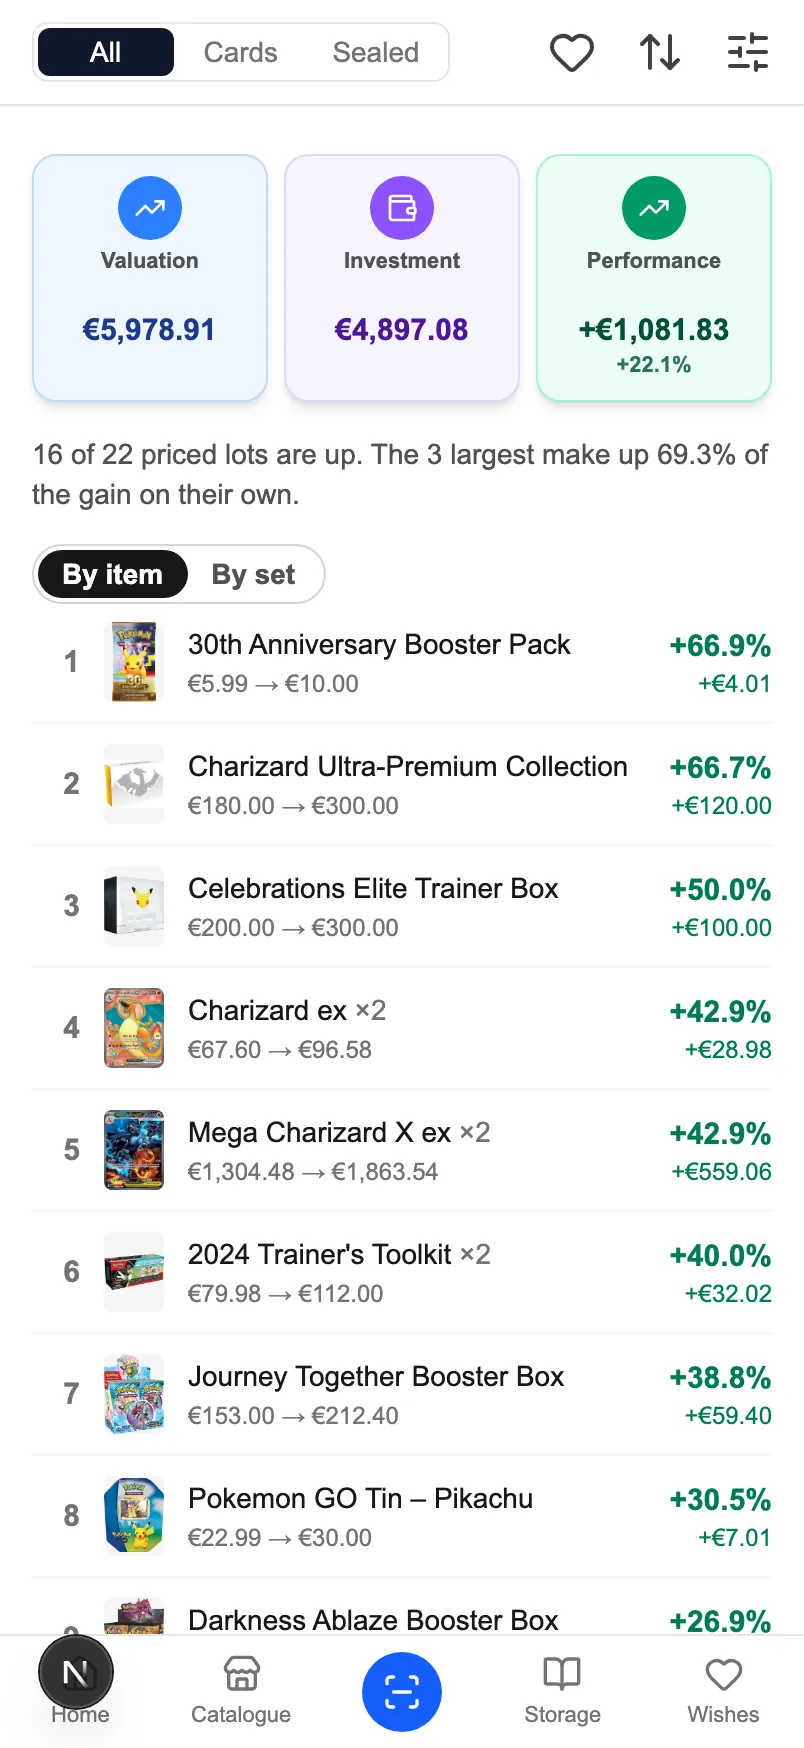
The investor view ranks the collection by return — what has performed best, and what weighs most in the total.
- Two tables: one per object, one per set. Both count the whole position, unit price multiplied by quantity, so their totals reconcile.
- A set's ROI is an average weighted by the amounts, never the average of the percentages.
- Objects with no reading close the ranking in both directions, and their number is shown — an unpriced object does not have a return of zero, it has none.
Alerts
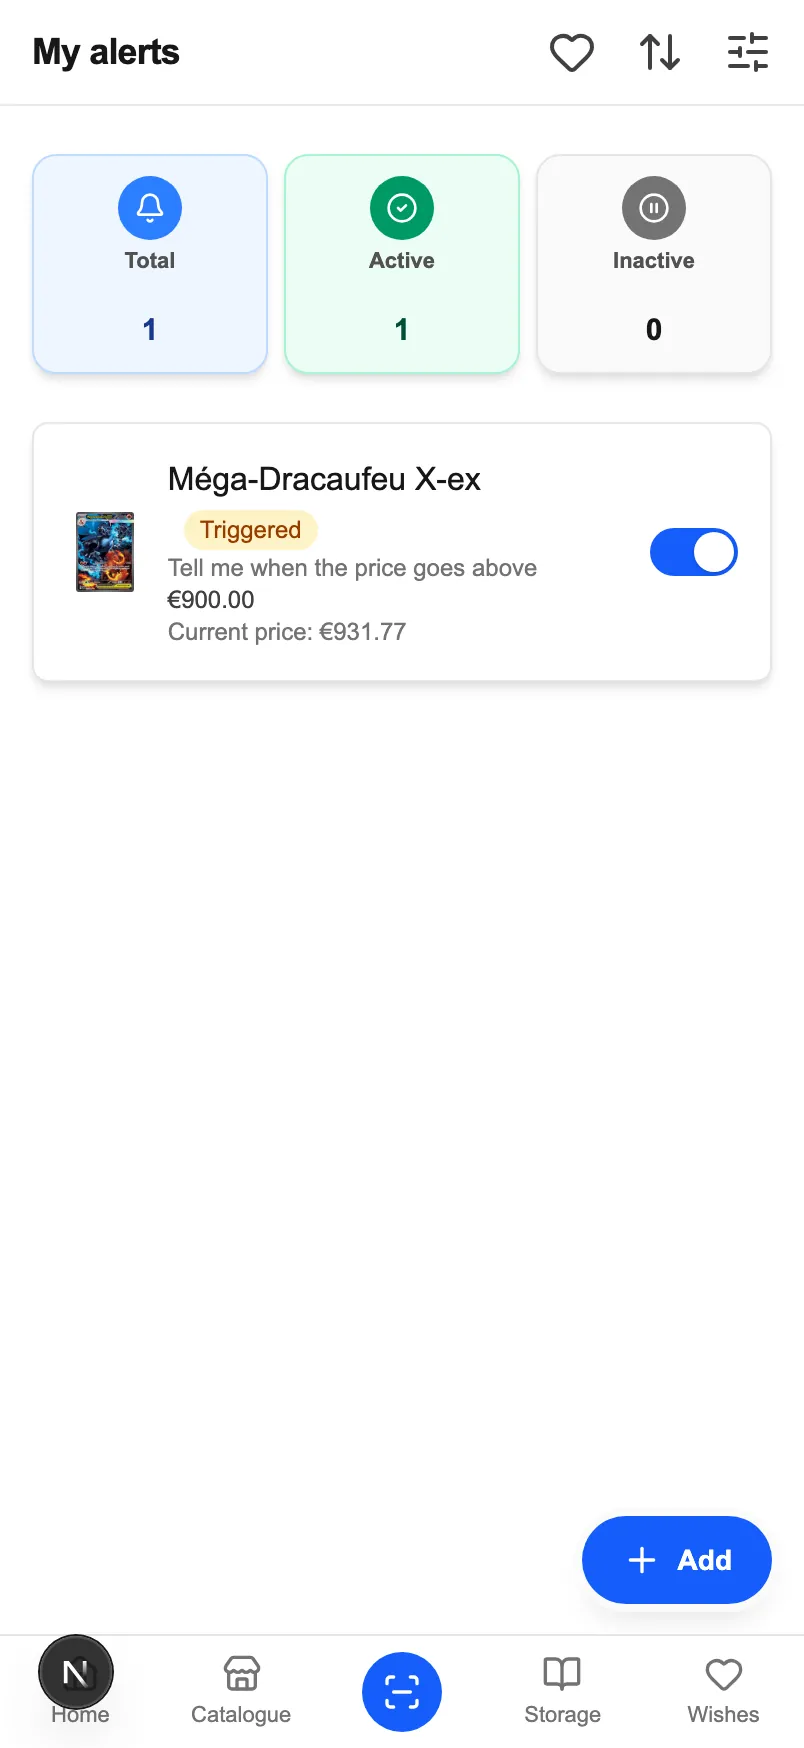
A threshold, a direction, and today's price.
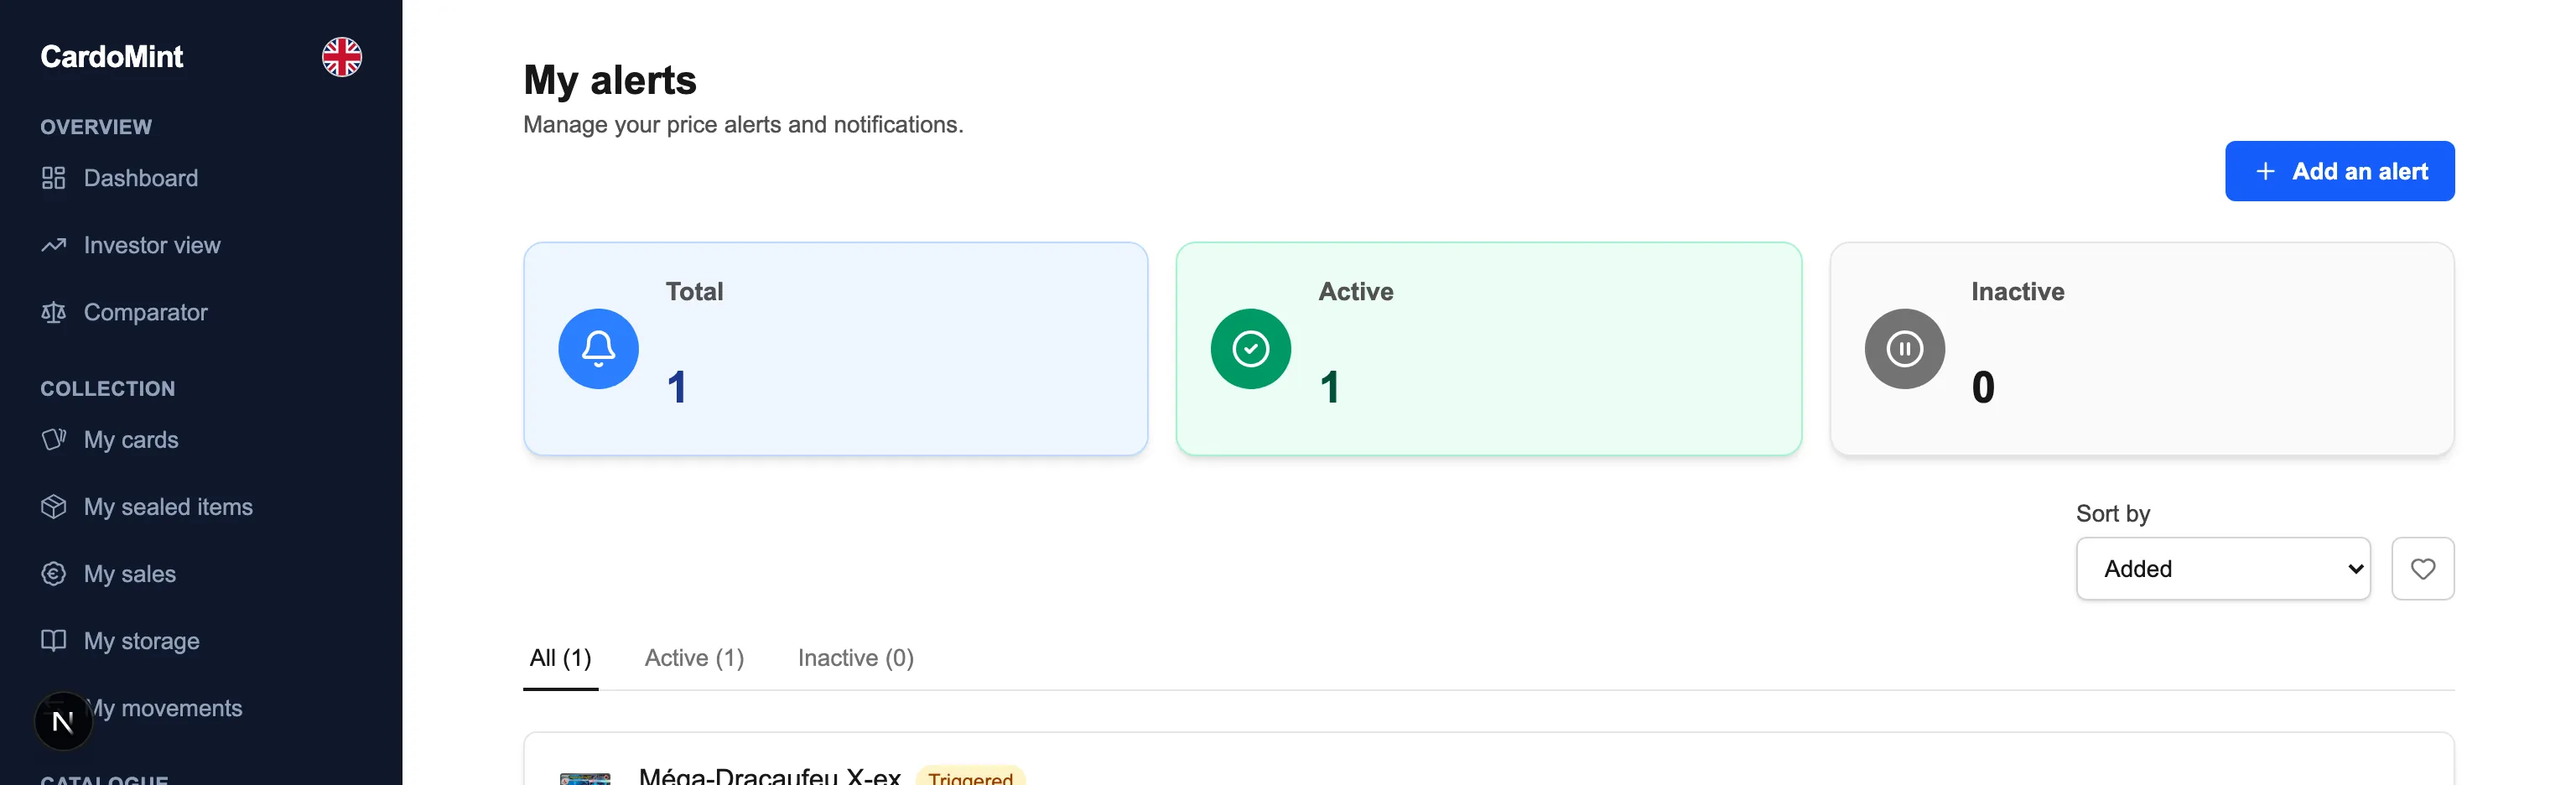
An alert carries the threshold AND the current price: a threshold on its own does not say how far off you are. The « Triggered » state is computed when the page opens.
- On a batch you own or on a catalogue card — what you watch most is the price of what you do not have yet.
- Two thresholds on one object are two legitimate watches: above 100 and below 50.
- Email notifications arrive with the sending service already put in place for password resets.
What makes the value
- Daily import
- The Cardmarket price of 11,640 cards, read every day and dated on screen.
- History built here
- The source publishes a price, never a time series: CardoMint records one point per card, per printing and per day. So the chart starts the day you open it, and says so.
- Price per printing
- Normal and reverse are not worth the same — up to a 10.4× gap measured. Both rows carry their own price.
- A price carries its date
- An amount without its date reads as today's. It is the daily import plus the date on screen that made storing a price acceptable.
- Every price says where it comes from
- Cardmarket prices 11,640 cards out of 67,432. The others show an absence, rather than a zero that would read as a value of nothing.
- Latent and realised gain
- Kept apart everywhere — tiles, charts, export. What a sale brought in is a fact; what a card is still worth is an estimate.
- Annualised performance, floored
- One month minimum on the denominator. Without that floor, +30% over 29 days showed +49,921%.
- TOP 5 and FLOP 5
- The best and the weakest positions. Objects with no reading are excluded, and their number is shown in their place.
- Price alerts
- A threshold, a direction, and the « Triggered » state computed at display time. On a batch you own or on a catalogue card.
All of it is open from day one
The entire app is available by invitation, free of charge.