Analysis
Read your collection another way.
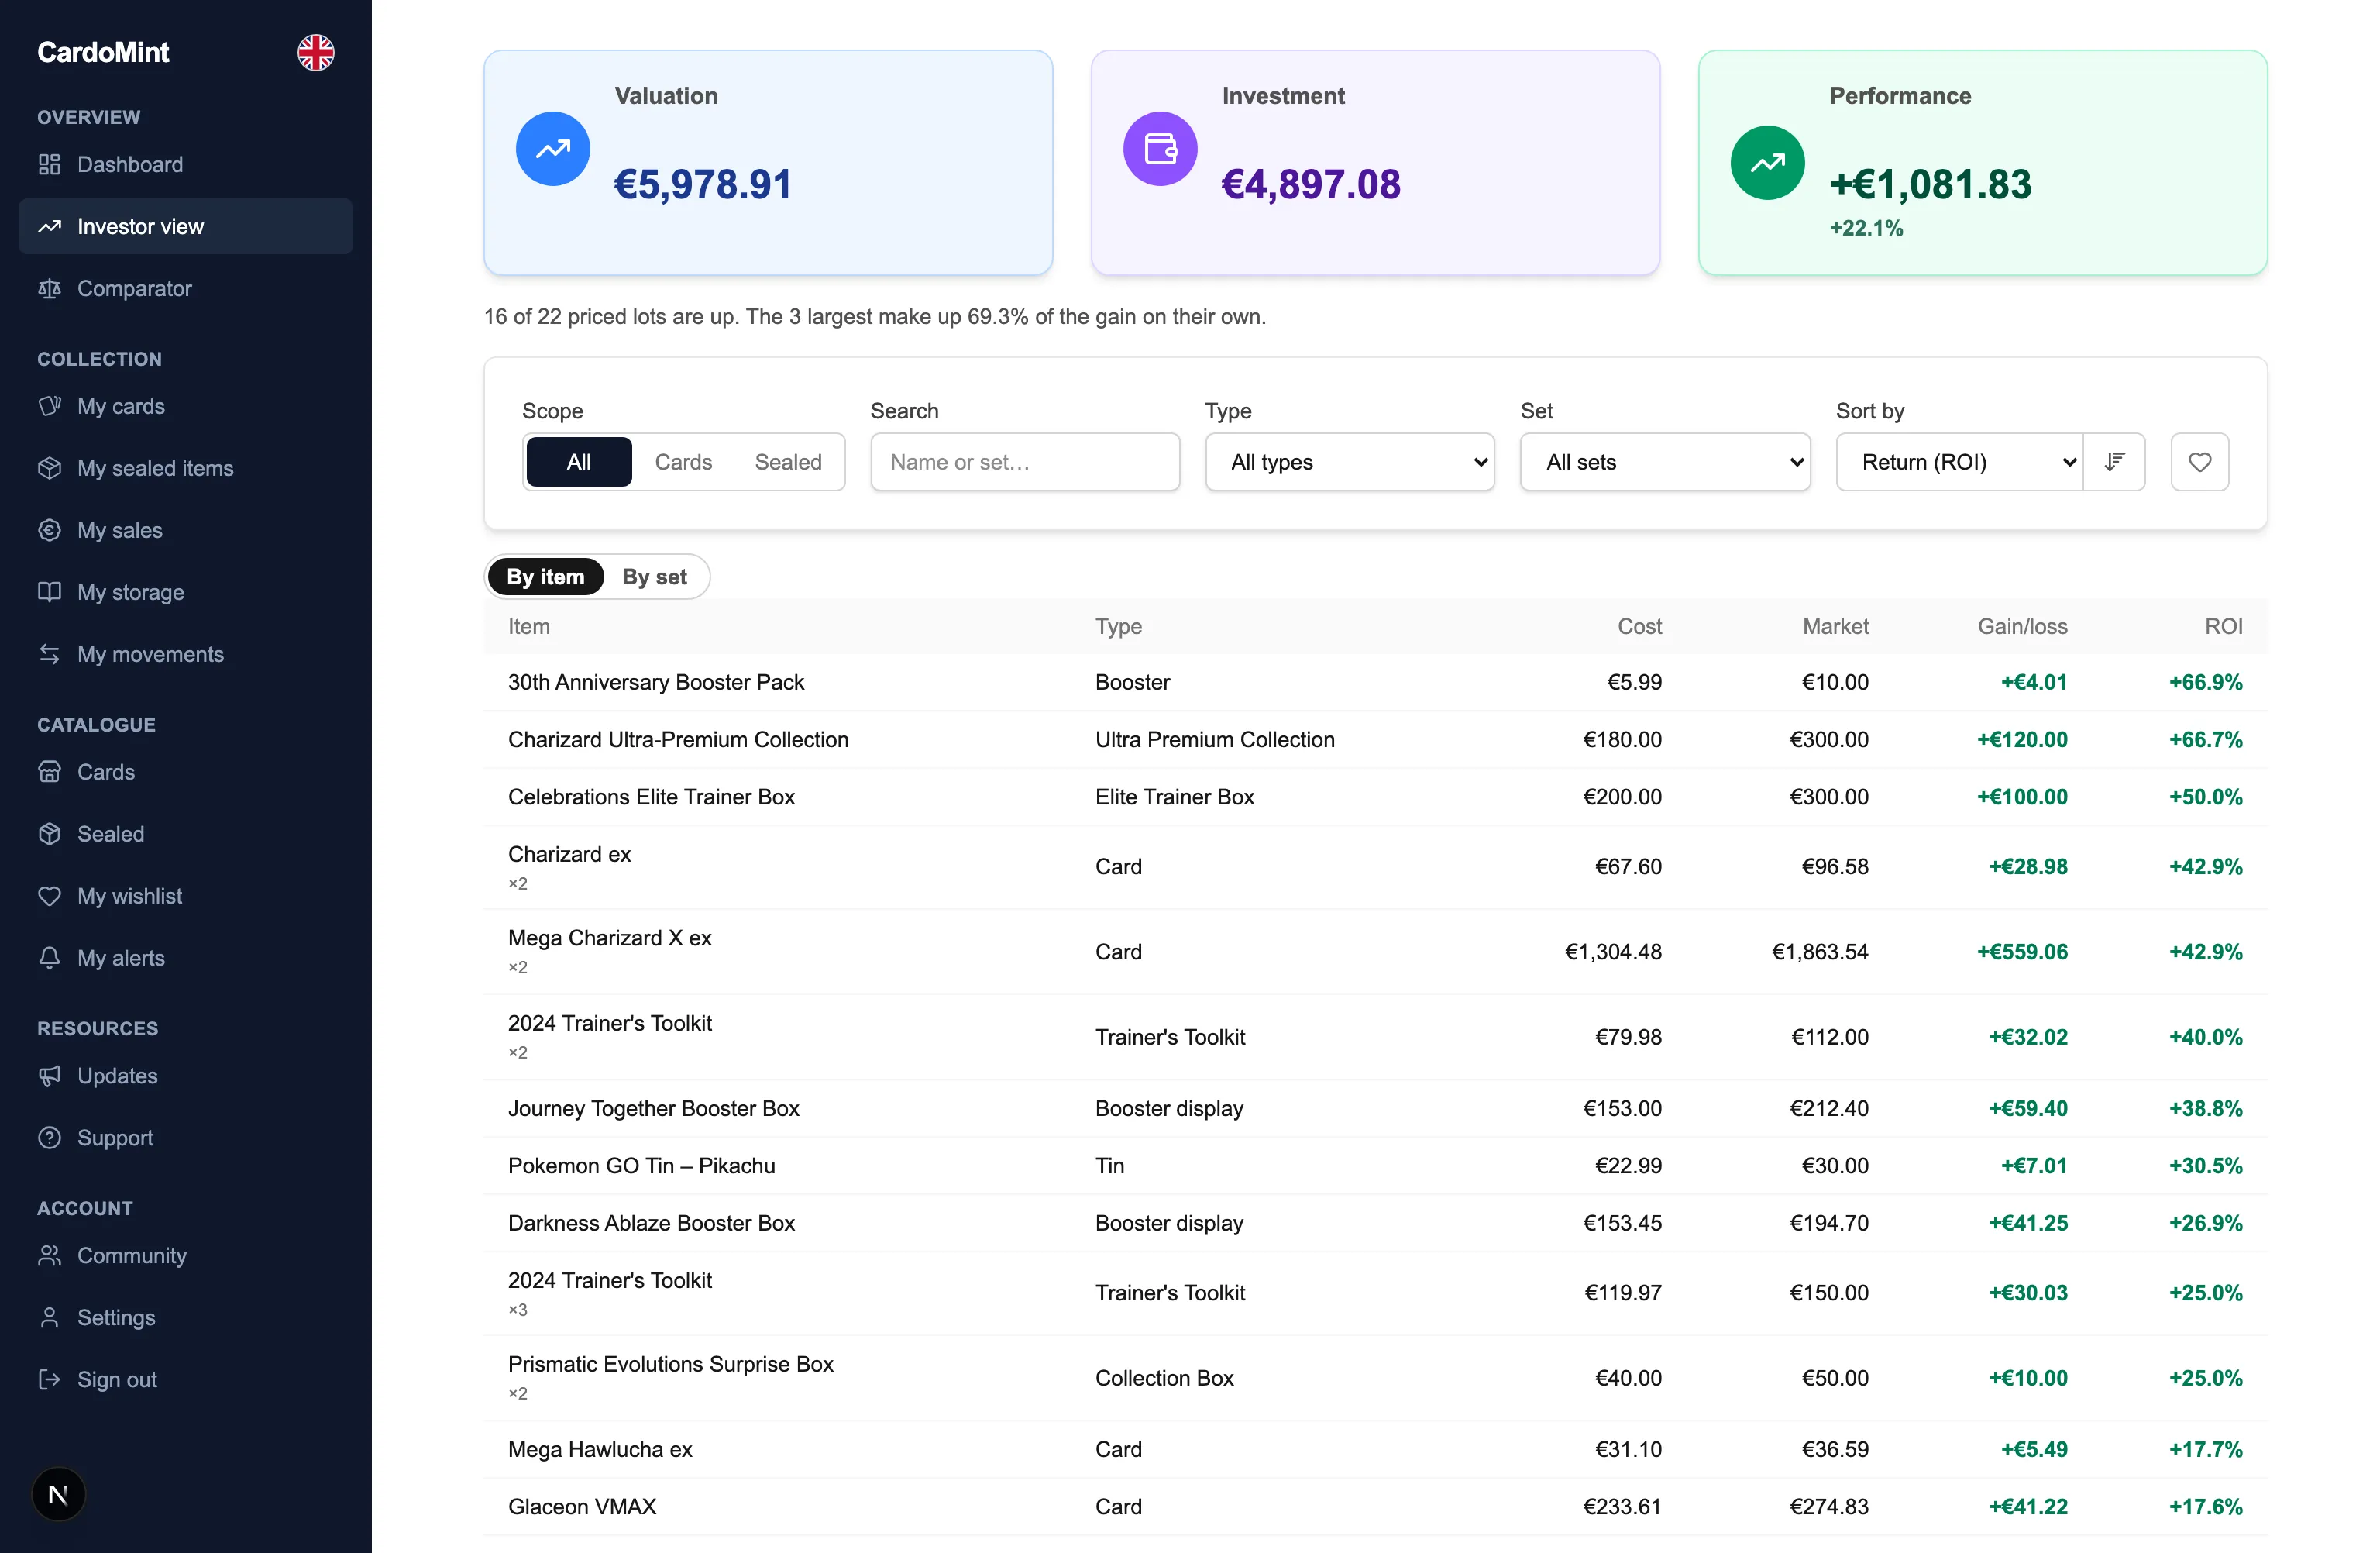
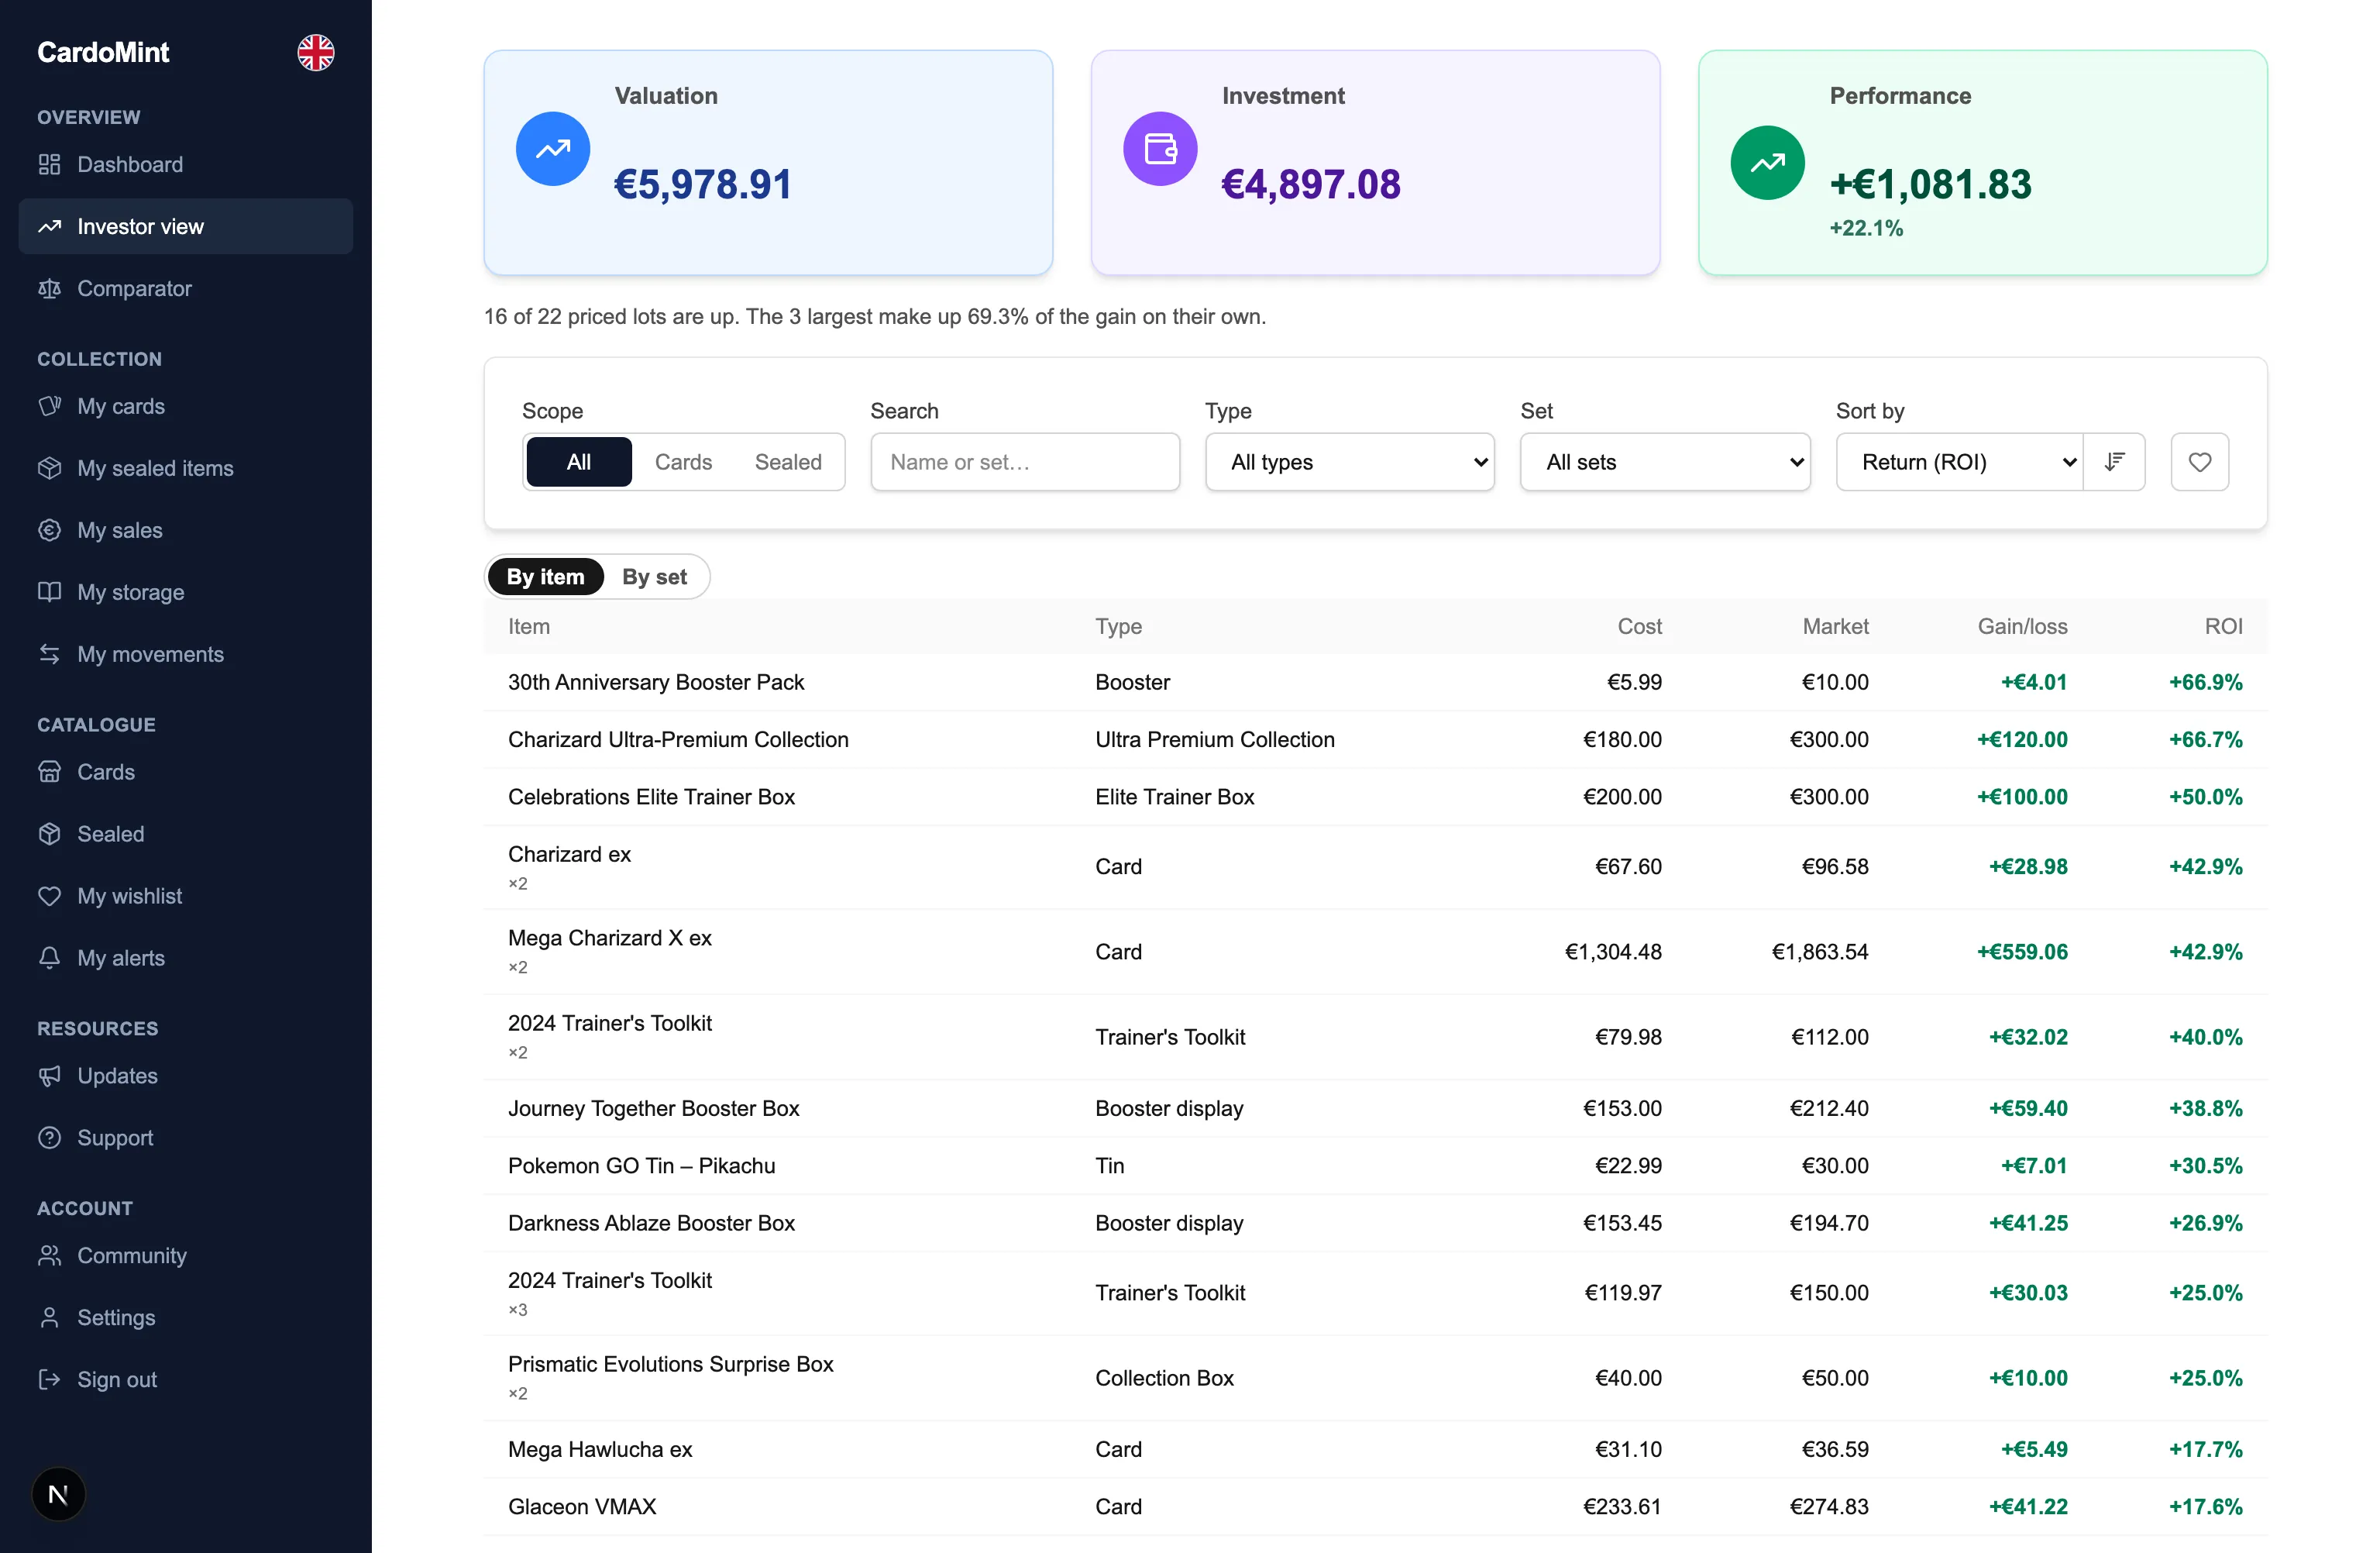
Investor view and movements: two screens that answer questions the grid never asks — what has performed best, and what has come in and gone out.
- ROI per product and per set, on the real position — cost × quantity, never the unit price.
- Two to four products side by side, with the best value marked on every row.
- A product with no price reading closes the ranking rather than entering it at zero.
Analyse
Three screens to read the collection another way.
1 / 5
- Dashboard
- Six tiles, the curve, the allocation, recent activity and the rankings — filterable across everything, cards or sealed.
- Investor view
- ROI per product and per set, on the cost of the whole position rather than the unit price.
- And the comparator, next door
- Putting 17 criteria of two to four products on the same row is a question of its own, and it has its own page.
- Every object says whether it is valued
- A line flags the products whose « current value » is only the purchase price echoed back — the easiest figure on the page to misread.
- Unified search
- The one screen that mixes cards and sealed products, with both counts written out in full.
All of it is open from day one
The entire app is available by invitation, free of charge.